
Hello,
I’m using your Spreat Sheet (‘CreateWUFIClimateFile.xls’) to create a *.try file. To complete this, I have measured climate data’s. They are measured in universal time (UTC) and they correspond to the previous hour (for example, for the rain it’s the total rain for the last hour).
I think, the data’s in the ‘CreateWUFIClimateFile.xls’ must be in local time. (so the hour ‘1’ for a day of a month must correspond to 1 hour in local time (and so on…)). They don’t take in account the summer time. Can you confirm this ? Must they also correspond to the previous hour ?
Thanks in advance,
Brigitte
Climate data’s in the Spreat Sheet in local time ?

Re: Climate data’s in the Spreat Sheet in local time ?
Hi Brigitte,
the times are supposed to be in the local zone time. The parameter dUTC which you have to enter in the spreadsheet tells WUFI wich time zone that is (WUFI reads dUTC from the auxiliary *.AGD file which is created together with the *.TRY file). If the time zone is UTC, use dUTC = 0, if it is Central European Time, use dUTC = 1 etc. Summer time is not taken into account.
In order to check whether the dUTC you entered is consistent with the time zone with respect to which the data have been measured, select your file, choose the tab 'Climate Analysis' in the climate dialog and click 'Analyze'. The solar radiation diagram should show the highest intensities for southern directions. If the highest intensities occur in a markedly different direction, either the dUTC you entered or the time scale of the measured data are wrong.
All data are the averages (or sums) over the hour preceding the time stamp. So if the line for 10h contains the temperature 8.4°C this means that the average temperature between 9h and 10h zone time was 8.4°C.
Bye,
Thomas
Hello Thomas,
Thanks a lot for your answer !
For the climate period I’m using at the moment, with the climate analysis in Wufi, I got a maximum intensity of the total solar radiation for the orientation between SSE and S. At the place of the measurements, the local time is UTC + 1h (dUTC= 1h) but the real time (solar time) is UTC + 20’. So I think it must be correct !?
Bye,
Brigitte
Looks okay, although it is slightly unusual that there is some visible deviation from due south.Brigitte wrote:For the climate period I’m using at the moment, with the climate analysis in Wufi, I got a maximum intensity of the total solar radiation for the orientation between SSE and S.
In the long-term average, the maximum intensity should always be exactly due south, because in that direction the sun is highest in the sky, regardless where in the time zone the location is and how much solar time differs from zone time. A slight asymmetry may arise if for that location the sky is always more (or less) hazy in the morning than in the afternoon, or if some major part of the sky is shadowed by some obstructing object.At the place of the measurements, the local time is UTC + 1h (dUTC= 1h) but the real time (solar time) is UTC + 20’. So I think it must be correct !?
A large asymmetry would arise if an incorrect dUTC is used. In order to create that solar radiation diagram WUFI has to compute the yearly radiation sums for receiving surfaces with different inclinations and orientations. Computing the amount of radiation incident on such a surface involves computing the solar position in the sky and accordingly splitting the measured radiation up into direct and diffuse components. If a wrong dUTC is used, the computed positions are not compatible with the measured amounts of radiation and the radiation sums computed for the different surfaces will be systematically in error. The diagram is then noticeably out of alignment.
If you only see a very slight asymmetry, it is very likely okay (your dUTC is certainly not off by one hour). Or might it be that your radiation data have been measured with respect to solar time, not zone time? Some weather stations do it that way...
Bye,
Thomas
If in doubt, you can also mail me your data. I can compare them with synthetic radiation data derived from an astronomical radiation model. It's easy to see if there is a systematic shift with respect to these 'ideal' daily profiles (sunset, sunrise always too early or too late etc.).Brigitte wrote:I will ask the confirmation that climate data’s were measured in local time or if there were measured in solar time.
Bye,
Thomas
Hi Thomas,
I send you the climate files.
But may be just one more thing… When you speak about the south direction for the maximum intensity of the total solar radiation, why do you speak about the ‘long-term average’ ; is it also valid for a short period (for example 2 or 3 weeks) or not ? (Even if in the climate analysis the values on this period are taken into account for this period and consider as ‘0’ for the rest of the year).
Brigitte
The sun is highest when it is due south, so on any clear day the highest intensity will be received by a south-facing surface. And since the solar path is symmetrical with respect to the south direction, a surface oriented x degrees to the west will receive the same total energy per day as a surface oriented x degrees to the east. Plotting these energy amounts for different inclinations and orientations (as is done in WUFI's solar radiation diagram) will result in a symmetrical pattern, with the highest intensities occurring on the south-facing surfaces.Brigitte wrote:But may be just one more thing… When you speak about the south direction for the maximum intensity of the total solar radiation, why do you speak about the ‘long-term average’ ; is it also valid for a short period (for example 2 or 3 weeks) or not ?
However, not all days are clear, and if you have, say, foggy mornings and clear afternoons for a while, the corresponding diagram will appear distorted and asymmetrical. In this case you need a longer averaging period to eliminate these meteorological effects. The length of period needed for this depends on the meteorological conditions.
The effect of using a wrong time zone for this analysis is easily visible in the diagram. You seem to have a much smaller asymmetry so your time zone is apparently correct. However, I'm not sure what the effect would be if the radiation data were measured in solar time instead of zone time (as expected by WUFI) and I'm not sure how much effect meteorological influences may have even after averaging over a considerable time period. But once you send me your data I can pick a sufficiently clear day and compare the radiation data hour by hour with the expected values; even a small shift in the time base will then be clearly visible.
Bye,
Thomas
Hi Brigitte,Brigitte wrote:I send you the climate files.
the solar radiation data in the file you sent me are okay; you just entered the geographical longitude where the latitude should be and vice versa. So when WUFI computed the radiation incident on surfaces with different orientations and inclinations for the radiation rose diagram, the solar positions were computed wrong and the resulting diagram was distorted.
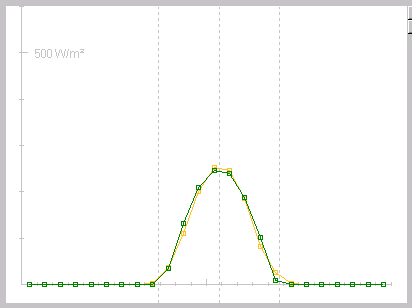
The measured data themselves look okay, and they are obviously measured with respect to Central European Time. The following diagram shows one day of your global radiation data (yellow) compared with a theoretical radiation profile for the same date and for a slightly hazy sky (green). The dotted lines mark the times of sunrise, transit and sunset. Evidently the yellow curve complies well with the theoretical expectation; in particular it is not shifted on the time axis.
Another remark concerning the climate data: you left the column for the atmospheric counterradiation empty, so the Excel sheet will automatically fill it with zeros. However, if you use a climate file in *.TRY format for the calculation, WUFI will attempt to model (although in a very rudimentary way) the longwave radiation exchange between the surface and the atmosphere. The atmospheric counterradiation is an important part of that radiation balance, and if it is always zero the computed surface temperatures will be much too low.
So you should either fill that column with plausible values, or leave them at zero but also set the long-wave radiation emissivity of the surface to zero in order to suppress any explicit longwave radiation exchange.
Bye,
Thomas