Analysis, interpretation and assessment of the calculation results
Posted: Wed Nov 21, 2018 11:12 pm -1100
Assessment Criteria
WUFI simulations are usually performed in order to gain insight into the performance of a construction, or into its durability and its resistance to damage. However, WUFI's calculations only provide results in terms of water contents, temperatures, moisture flows etc. These numerical results need to be assessed in order to allow the desired conclusions about the operational properties of the component.
Due to the large variety of possible damage and failure mechanisms, currently no automatic assessment is possible in general. Instead, the interpretation of the results must draw on the technical expertise and experience of the user. Often, many details of the possible damage mechanisms are as yet unknown, since it is only now that it has become possible to investigate them in detail, assisted by quantitative simulations. Many damage mechanisms are the subject of current research, so that automatically applicable assessment criteria might become available. If such criteria can been established, they may be implemented in WUFI post-processors for automatic evaluation of the numerical results.
The following sections discuss some aspects which, depending on the specific case, may be relevant for the assessment of calculation results (see also [1]):
General
Water contents in the component at the level of normal sorption moisture when exposed to ambient air are completely normal. However, many damage types are caused or promoted by excessive water contents. As a general rule, therefore, the accumulation of too much moisture is to be avoided.
An initial increase or decrease of the water content is normal if the user-specified initial water content is lower or higher than the water contents of the resulting periodic equilibrium state. Seasonal variations of the total water content are also normal, as long as they are confined to a limited range of variation. Seasonal variations of the water contents of individual layers may be associated with the variations of the total water content, or they may be caused by periodic redistribution of moisture within the component (and are then often anti-synchronous in two layers exchanging moisture).
If the total water content or the mean water content in one of the layers keeps increasing over a multi-year calculation, this usually indicates a potential problem, since one of the issues discussed below will probably occur sooner or later.
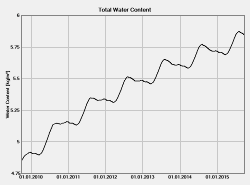
A long-term increase of water contents will result if more ambient moisture is brought into the component or the layer by diffusion, convection or capillary transport than can dry out. In addition, water contents of individual layers can increase if built-in moisture from a layer is redistributed and permanently accumulates in other layers.
Wood Rot
According to standard DIN 68800:2012-2, the prevention of wood rot requires that the mass-specific water content of wood may not exceed 20 mass-percent over prolonged periods of time (18 mass percent for processed wood). Similar criteria apply to organic fiber insulations, such as cellulose fibers or textile fibers.
These limits contain some safety margin. The wood rot fungi need moisture contents exceeding the fiber saturation of about 25 to 30 mass-percent to be able to extract enough moisture from the wood to start the decomposition process.
Moisture exceeding the limits for a short time can be safely tolerated. Low temperatures reduce or even prevent the growth of the fungi, so that under these conditions exceeding the limits even for longer time may be admissible.
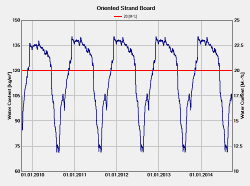
WUFI's Quick Graphs for the moisture contents in the individual layers allow to add to the graph a red reference line at a user-defined mass-percent level which makes it easy to spot moisture contents exceeding that level.
The WTA Guideline on the assessment of humidity in timber constructions [9] [10] proposes a more differentiated criterion. For solid wood products, the daily mean of the relative humidity of the pore air (averaged over the most critical 10 mm of the solid wood product) must not exceed 95% at 0°C and 86% at 30°. Well-considered exceptions are permissible for individual short-term violations of the limit.
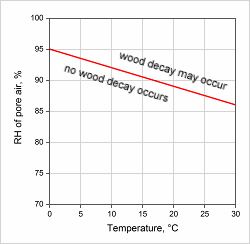
This temperature-dependent assessment takes into account that the growth potential of wood rot fungi is reduced at lower temperatures. The limiting curve is a simplified representation of experimental results which showed no decay in spore-infested wood samples (poorly resistant sap wood from spruce/pine) even after twelve months, if conditions remained below the limiting curve. When the limiting curve is exceeded, wood decay need not necessarily begin - this situation must be assessed with an appropriate assessment model such as the wood rot model of Viitanen for which a post-processor is under development.
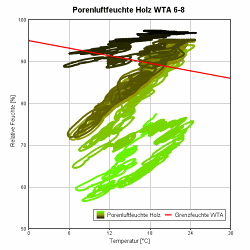
The diagram type "wood moisture WTA" in WUFI's visualisation and analysis tool WUFIGraph draws the temperature-dependent critical WTA curve in a diagram of WUFI's calculation results, showing at a glance whether the critical moisture is exceeded:
Mold Growth
The indoor surface of a building component may be susceptible to mold growth if it provides suitably high moisture and temperature conditions. Standard DIN 4108 specifies a critical value of 80% RH at the surface. This value refers to the mold growth risk on thermal bridges in winter, i.e. 12.6°C (this is the surface temperature at which the supposed indoor air conditions of 20°C / 50% RH result in the critical indoor surface humidity of 80%). At higher temperatures, in particular in summer, a surface humidity of about 75% will be sufficient to allow mold growth.
WUFI's Quick Graphs include temperature-moisture diagrams for the monitor positions, showing the computed relative humidity plotted against the corresponding temperature for each calculational time step. Different regions in such a diagram also represent different growth conditions for mold fungi, as far as these growth conditions are determined by the moisture and temperature conditions.
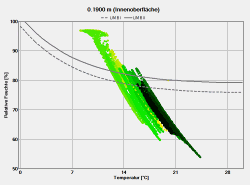
The temperature-moisture diagram for the indoor surface displays limiting curves showing the minimum growth conditions characteristic for the nutrient supply usually found on building materials. (limiting curves LIM B I and LIM B II). If the temperature and moisture conditions stay below these curves, usually no mold growth is to be expected.
If the limiting curves are exceeded for a longer period of time, the mold growth risk depends on the duration and the extent of the mold-friendly conditions. This more complex situation can be assessed by the biohygrothermal model which determines the changing moisture content in a model fungus spore - and thus its germination and growth potential - in dependence of the temperature and humidity conditions provided by WUFI for the respective surface. The post-processor "WUFI Bio" uses this model for predicting the mold growth risk. The post-processor "WUFI Mould Index VTT", developed in cooperation with VTT (Finland), uses the Viitanen model to assess the mold growth risk. The post-processor "Moisture Resistance Design (MRD) model", developed by Uni Lund (Sweden), evaluates the risk of mould growth in accordance with the Swedish approach.
It is conceivable that the limiting curve criterion may be also applicable for assessing the mold growth risk in cavities within the building component, but this has not yet been verified.
On exterior surfaces mold growth may be prevented by solar radiation (fungicidal action of high temperatures and UV radiation) and rain (spores being washed off), even if the limiting curve criterion would allow it. Realistic assessment of this situation would require appropriate models which do not yet exist.
Heat Loss
Even in insulation materials which are not damaged by moisture (e.g. foam plastics), high moisture contents (e.g. due to condensation) may be detrimental if they increase thermal conductivity and thus impair insulation quality to an unacceptable degree. The moisture-dependent thermal conductivity or the moisture-induced heat conductivity supplement of the insulation material can be used to estimate the moisture content above which the loss of insulation quality is not acceptable. In general, it may be assumed that up to a moisture content of about 2 volume percent the effect on thermal conductivity is small.
Depending on the vapor permeability of the insulation material, the contribution of the vapor transport across the insulation layer has to be taken into account, because the latent heat transported with the vapor also reduces the insulation quality. The "Thermal Transmission" post-processor included with WUFI analyses the insulation quality of the moist component, based on the resulting heat flows.
Amount of Condensate on Surfaces
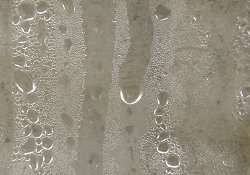
Non-hygroscopic materials and materials with low sorptive capacity cannot bind infiltrated moisture by sorption on their pore surfaces. Under condensation conditions, liquid water will be deposited within the materials. This is the case, for example, with rock wool or mineral wool. On the cold side of these types of insulation, condensate may form.
Even if the affected materials are not susceptible to moisture-damage themselves, condensate deposited in larger quantities may run off and cause moisture damage elsewhere.
Standard DIN EN ISO 13788 [3] therefore advises that the amount of condensate should not exceed 200 g/m2 if the materials in the condensation region can not absorb the moisture.
Likewise, Krus and Rösler [4] find by experiment that in various kinds of mineral wool mounted on non-sorptive vertical surfaces, condensate forming in the interface region of the samples starts running off when amounts of 200 g/m2 are reached.
Standard DIN 4108 [5] gives 500 g/m2 as maximum admissible amount of condensate at the interface of two layers if at least one of them is not capillary-active.
Similar considerations apply to air gaps. Since air cannot absorb moisture, under condensation conditions moisture will be deposited on the surfaces of the materials bounding the air gap. If these materials are not absorptive, larger amounts of moisture can accumulate and run off.
British Standard BS 5250 [6] provides a differentiated list:
The process of running-off can not be simulated by WUFI. In the simulation, the water content just keeps increasing. The user must assess whether a moisture content has been reached which would run off in reality.
If water starts to run off because it locally exceeds the maximum stable amount of condensate, it may entrain other water it encounters which would itself not have exceeded the limit. Therefore, it is not to be expected that an increasing amount of condensate simply stagnates when it reaches the maximum stable amount, with only surplus condensate running off. Instead, fluctuations of the water content will usually occur.
Our tutorial
https://wufi.de/en/service/downloads#co ... assessment
describes in detail how to assess the amount of condensation in hydrophobic mineral wool.
Amount of Condensate inside a Material
The assessment criterion described above only refers to the damage risk caused by the running-off of condensate which has been deposited on a non-absorbing surface.
While the total amount of condensate deposited within the component, familiar from the traditional Glaser-type calculations, might appear to be a simple and easily applicable assessment criterion, there are various reasons why its applicability to realistic hygrothermal simulations is limited.
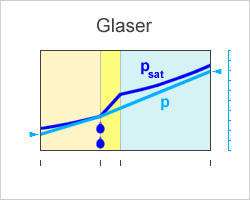
A Glaser-type calculation first determines the temperature profile and the vapor pressure profile resulting in a component which is exposed to steady-state design conditions. If at some point within the component the vapor pressure p reaches the local saturation vapor pressure psat (which is determined by the temperature profile), the occurrence of "dew conditions" is stated: Relative humidity reaches 100 % at that point and "dew water" is deposited, the amount of which depends on the vapor pressure profile and the duration of the dew conditions. Depending on the relevant design regulations, it may be required
The Glaser method, which has been developed for the design of insulation layers in the walls of refrigerated warehouses, assumes non-hygroscopic materials. In such materials, moisture can only occur as dew water. For given steady-state boundary conditions it can be determined unambiguously whether dew water occurs or not. In a Glaser calculation, the term "dew conditions" refers to both
In steady-state Glaser calculations for non-hygroscopic materials, these two conditions always occur simultaneously. In a Glaser-type assessment they are therefore equivalent.
However, most building materials are hygroscopic, and their sorption capacity fundamentally changes their moisture behavior. In most cases, the terms "dew conditions" and "dew water" do not apply usefully to these materials.
The same caveats apply to the criterion which compares the temperature profile in the component with the dew point temperature profile and states "dew conditions" when and where the two profiles coincide. This is identical with the Glaser criterion of comparing vapor pressure and saturation vapor pressure, it is just expressed in different physical terms.
Summary:
Instead of using "dew conditions" and "dew water amounts" as criteria, it is preferable to perform a hygrothermal simulation to determine the water contents to be expected in the component, taking all relevant material properties and moisture transport mechanisms into account. The resulting water contents can then be assessed by the criteria described in the present discussion, depending on the potential damage mechanisms.
In practice, despite the caveats discussed above, increased water contents which are caused entirely or mainly by vapor transport (not by capillary transport) are often somewhat loosely called "dew water" for brevity.
When simulation results are analyzed, the term "dew water" may be used in this sense, if only the change in water content is being assessed and as long as no attempt is made to analyze absolute "amounts of dew water" or the occurrence of "dew conditions" because these are ill-defined in hygroscopic materials.
Moisture contents exceeding free saturation may legitimately be called "dew water". But if such high moisture contents result in the component, in most cases some of the other water content criteria discussed here may already have been exceeded. So this criterion should probably not be used as the only one.
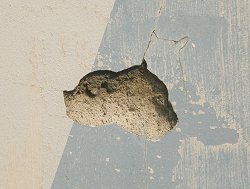
Frost Damage Risk
Because of the volume expansion of freezing water, high water contents exposed to a sufficient number of freeze-thaw cycles may weaken and damage the inner structure of a porous building material. The susceptibility to frost damage depends on the kind of the material and on its water content during freezing.
Frost-resistant materials usually can endure freezing water contents up to at least free saturation without suffering frost damage. Frost-susceptible materials, on the other hand, should not exceed certain water contents during freezing periods. Lime-silica bricks, for example, may suffer frost damage above water contents of about 12 mass-percent when exposed to typical central-European winter temperatures. However, for most materials no critical moisture contents and temperature limits are known as yet.
The WTA Guideline on interior insulation [2] recommends that frost-susceptible materials should not exceed a saturation degree of 30% (i.e. 30% of the maximum water content wmax). This criterion includes a safety factor 2. Higher degrees of saturation are admissible if the relative humidity of the pore air remains below 95%. According to current knowledge, this should preclude frost damage even in sensitive materials.
Of course, for materials which are moisture sensitive in some other respect, the corresponding maximum admissible moisture content should take precedence.
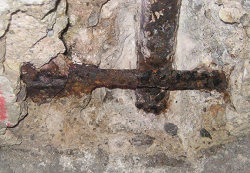
Corrosion
Metallic components of the construction may corrode when exposed to high humidity. An example is reinforcing steel in concrete, when the corrosion protection provided by the alkalinity of the concrete ceases with increasing carbonation. As a rough criterion it may be assumed that corrosion of steel in carbonated concrete is negligible below relative humidities of the pore air of 80%. The post-processor "WUFI-Corr" can be used for estimating the corrosion rate [8] in dependence of humidity and temperature under corrosion conditions.
Other Criteria
Other aspects relevant for some situations include moisture-induced loss of strength, chemical processes, aging etc. However, not much is currently known about criteria for assessing these processes.
Example: Interior Insulations
As a concrete example for a set of assessment criteria, an interior insulation applied to the indoor side of an exterior wall will be considered.
An exterior insulation raises the insulated wall to a higher temperature level (thus improving the drying of any moisture present in the wall), protects the wall from driving rain and other exterior load factors, and it mitigates thermal bridges. A massive wall prevents diffusion transport from the indoor air into the exterior insulation, so that usually no condensation problems are to be expected in the insulation layer.
An interior insulation, on the other hand, decouples the wall from the indoor temperature level, so that the temperature level of the wall is lower compared to the uninsulated wall. The reduced and possibly insufficient drying potential may lead to moisture accumulation; the combination of elevated moisture content and reduced temperature may cause frost damage in previously damage-free facades. In thicker insulation layers there is a risk that in the region close to the wall the temperature of the insulation may drop below the dew point temperature of the indoor air. To prevent moisture damage, diffusion transport must then be kept sufficiently small, or condensed water must be drawn off by capillary transport (e.g. by a capillary active insulation material, or - within limits - by an absorptive wall surface). No indoor air must be allowed to penetrate behind the insulation.
In many cases, the design of the interior insulation can be done with planning documents provided by the manufacturers. In cases not covered by these planning tools, hygrothermal simulations can be used at the planning stage to assess the necessity and the effectiveness of possible additional moisture-controlling measures, such as driving rain protection, water-repellent treatment or diffusion control.
WTA Guideline 6-5 [2] offers guidance on how to perform such simulations and how to assess the results. It provides the following critical limits:
For the assessment of the moisture contents which may vary markedly across a material layer, it is recommended to evaluate that 10 mm thick layer subsection in which the highest moisture content occurs.
It is expressly not required that the relative humidity at the interface between insulation and wall be limited to 80% RH (which would be necessary at the surface of the uninsulated wall, cf. section "Mold Growth"). No mold can grow here if no gaps are left between the insulation and the wall.
More Severe Conditions
Often the aim is not to assess the behavior of the component under average, typical conditions, but its durability and performance under more severe conditions or design conditions. For this purpose, simulations can be performed in which the component is exposed to conditions that are favorable for the damage mechanism under study.
The potential susceptibility of the component to a large variety of damage mechanisms can be investigated by exposing it to more severe weather conditions. See the topic "Creating Climate Files" for a more detailed discussion in WUFI's help file.
In order to ensure a sufficient drying potential of the component, the simulation can be started with a realistically increased initial moisture content, such as masonry containing built-in construction moisture or wood sheathing exposed to rain during construction. This built-in moisture must be able to dry out without leaving any damage to the construction.
Since building components never are completely tight, air convection or driving rain may be able to transport moisture into the component, which also must be able to dry out and therefore should be taken into account by the simulation. Usually, the moisture entry paths are three-dimensional and can not be fully modelled by one- or two-dimensional simulation programs. Therefore, WUFI itself can not determine where any moisture carried in along these paths will appear in the component. However, the user can put moisture sources at those places in the component where according to experience infiltrated moisture will appear.
• Light-weight constructions, for example, are never completely airtight. In the upper part of the building, pressure differences between the indoor and outdoor air, created mainly in winter by the thermal buoyancy of the warm indoor air, cause convection through the component which carries moist indoor air towards the outdoor side. If the air streaming along the flow path (which may be quite meandering) cools below the dewpoint temperature of the indoor air, moisture will condense in the component. This additional moisture must be able to dry out without causing damage. Standard DIN 68800 therefore requires that this type of leak be suitably taken into account by a hygrothermal design. In WUFI, this can be done by defining a moisture source at an appropriate place in the component and let the "Air infiltration model IBP" control its moisture release rate in dependence of the component and the ambient climate conditions.
For steady-state calculations the standard assumes that an infiltrated moisture amount of 250 g/m2 must be expected to be deposited during winter and must be able to dry out. This number may also be used as a rough guideline for transient simulations.
• Driving rain leaks are yet another moisture source: In walls with facade insulation or sheathing, rain water often penetrates behind the insulation or sheathing through connection details such as window reveals. American standard ASHRAE 160 [7] therefore requires that for each rain event 1 percent of the rain hitting the facade must be released in the supporting structure behind the insulation. This additional moisture load must be able to dry out without causing damage. The required amount of "1 percent" was determined by adjusting simulations to reproduce real cases with and without damage. In WUFI, the user defines a moisture source at the appropriate place in the component and selects "Fraction of Driving Rain" as the source type controlling the moisture release rate.
Uncertainties
A numerical simulation reads the provided set of input data (material data, surface transfer coefficients, weather data...) and returns the mathematically determined result data. However, the input data will never perfectly correspond to the real object to be simulated.
The material data, for example, often are only available as a generic data set describing a material class. Even if material data for a specific material have been individually measured, there are still measurement uncertainties, production-related variations or even changes of the product formulation between production runs to be reckoned with. If the simulations serve to develop new materials, only hypothetical data sets can initially be used.
Measured weather data are available only for selected locations and for limited periods of time. Using them for the locations and (usually future) times under study introduces uncertainties. There may be changes in the exposition to weather (e.g. shading trees being planted, or growing, or being removed), or changes in the building use (resulting in a different indoor climate), etc. etc.
In general, the uncertainty of the resulting assessment will increase with increasing uncertainty of the input parameters, but different parameters will affect the result to different degrees.
The question which parameters need to be determined with which precision in order to produce a result within the desired certainty can be answered by using WUFI itself. If variation of a parameter (within a reasonable range) shows that the resulting assessments are not affected significantly, the sensitivity of the result with respect to this parameter is low and a plausible estimate of the parameter will be sufficient. On the other hand, if variation of a parameter produces variations of the resulting assessments which exceed the acceptable range, this parameter needs to be determined with higher precision. Again, WUFI can be used for parameter variations which determine the required precision level for this parameter.
Simple climate variations can be achieved by using weather data for different locations, by applying a temperature shift (within a limited range) or by applying variations of the surface transfer coefficients (within a limited range).
The sensitivity with respect to a given parameter (e.g. the µ value of an OSB board) can strongly depend on the concrete case at hand. If the OSB board has a vapor-retarding function in the component and this function is essential for the performance of the component under the given boundary conditions, high sensitivity is to be expected. On the other hand, if the board is used at a different place within the component, where its vapor retarding property is without function, or if no condensation risk exists under the given boundary conditions, then low sensitivity with respect to the same µ value is to be expected.
Literature:
[1] Zirkelbach, D.: Hygrothermische Simulation - Anwendungsmöglichkeiten für Planer und Sachverständige.
ISK 2013 - 12. Internationale Baufach- und Sachverständigentagung Ausbau und Fassade 11./12. Oktober 2013 in Regensburg (online)
[2] WTA-Merkblatt E 6-5-12/D: Innendämmung nach WTA II - Nachweis von Innendämmsystemen mittels numerischer Berechnungsverfahren.
Entwurf November 2012
[3] DIN EN ISO 13788: 2001-11: Wärme- und feuchtetechnisches Verhalten von Bauteilen und Bauelementen - Oberflächentemperatur zur Vermeidung von kritischer Oberflächenfeuchte und Tauwasserbildung im Bauteilinneren - Berechnungsverfahren.
Beuth Verlag Berlin, 2001
[4] Krus, M., Rösler, D.: Hygrothermische Berechnung der Einsatzgrenzen unterschiedlicher Systeme bei der Aufdoppelung von Wärmedämmverbundsystemen.
Bauphysik 33 (2011), Heft 3, 142-149, DOI: 10.1002/bapi.201110017
[5] DIN 4108-3: Wärmeschutz und Energie-Einsparung in Gebäuden. Teil 3: Klimabedingter Feuchteschutz - Anforderungen, Berechnungsverfahren und Hinweise für Planung und Ausführung.
November 2014. Beuth Verlag Berlin
[6] BSI 5250:2011: Control of condensation in buildings.
BSI - British Standards Institution, London, 2011
[7] ASHRAE ANSI Standard 160: Criteria for Moisture-Control Design Analysis in Buildings.
2009
[8] Carsana, M., Marra, E., Bertolini, L.: Corrosion behaviour of metal inserts in simulated ancient masonry mortars.
Construction and Building Materials 95 (2015) 457-466
[9] WTA-Merkblatt 6-8-15: Feuchtetechnische Bewertung von Holzbauteilen - Vereinfachte Nachweise und Simulation.
WTA
[10] Kehl, D.: Feuchtetechnische Bemessung von Holzkonstruktionen nach WTA.
Holzbau - die neue quadriga 6/2013, 24-28 (online)
WUFI simulations are usually performed in order to gain insight into the performance of a construction, or into its durability and its resistance to damage. However, WUFI's calculations only provide results in terms of water contents, temperatures, moisture flows etc. These numerical results need to be assessed in order to allow the desired conclusions about the operational properties of the component.
Due to the large variety of possible damage and failure mechanisms, currently no automatic assessment is possible in general. Instead, the interpretation of the results must draw on the technical expertise and experience of the user. Often, many details of the possible damage mechanisms are as yet unknown, since it is only now that it has become possible to investigate them in detail, assisted by quantitative simulations. Many damage mechanisms are the subject of current research, so that automatically applicable assessment criteria might become available. If such criteria can been established, they may be implemented in WUFI post-processors for automatic evaluation of the numerical results.
The following sections discuss some aspects which, depending on the specific case, may be relevant for the assessment of calculation results (see also [1]):
General
Water contents in the component at the level of normal sorption moisture when exposed to ambient air are completely normal. However, many damage types are caused or promoted by excessive water contents. As a general rule, therefore, the accumulation of too much moisture is to be avoided.
An initial increase or decrease of the water content is normal if the user-specified initial water content is lower or higher than the water contents of the resulting periodic equilibrium state. Seasonal variations of the total water content are also normal, as long as they are confined to a limited range of variation. Seasonal variations of the water contents of individual layers may be associated with the variations of the total water content, or they may be caused by periodic redistribution of moisture within the component (and are then often anti-synchronous in two layers exchanging moisture).
If the total water content or the mean water content in one of the layers keeps increasing over a multi-year calculation, this usually indicates a potential problem, since one of the issues discussed below will probably occur sooner or later.
A long-term increase of water contents will result if more ambient moisture is brought into the component or the layer by diffusion, convection or capillary transport than can dry out. In addition, water contents of individual layers can increase if built-in moisture from a layer is redistributed and permanently accumulates in other layers.
Wood Rot
According to standard DIN 68800:2012-2, the prevention of wood rot requires that the mass-specific water content of wood may not exceed 20 mass-percent over prolonged periods of time (18 mass percent for processed wood). Similar criteria apply to organic fiber insulations, such as cellulose fibers or textile fibers.
These limits contain some safety margin. The wood rot fungi need moisture contents exceeding the fiber saturation of about 25 to 30 mass-percent to be able to extract enough moisture from the wood to start the decomposition process.
Moisture exceeding the limits for a short time can be safely tolerated. Low temperatures reduce or even prevent the growth of the fungi, so that under these conditions exceeding the limits even for longer time may be admissible.
WUFI's Quick Graphs for the moisture contents in the individual layers allow to add to the graph a red reference line at a user-defined mass-percent level which makes it easy to spot moisture contents exceeding that level.
The WTA Guideline on the assessment of humidity in timber constructions [9] [10] proposes a more differentiated criterion. For solid wood products, the daily mean of the relative humidity of the pore air (averaged over the most critical 10 mm of the solid wood product) must not exceed 95% at 0°C and 86% at 30°. Well-considered exceptions are permissible for individual short-term violations of the limit.
This temperature-dependent assessment takes into account that the growth potential of wood rot fungi is reduced at lower temperatures. The limiting curve is a simplified representation of experimental results which showed no decay in spore-infested wood samples (poorly resistant sap wood from spruce/pine) even after twelve months, if conditions remained below the limiting curve. When the limiting curve is exceeded, wood decay need not necessarily begin - this situation must be assessed with an appropriate assessment model such as the wood rot model of Viitanen for which a post-processor is under development.
The diagram type "wood moisture WTA" in WUFI's visualisation and analysis tool WUFIGraph draws the temperature-dependent critical WTA curve in a diagram of WUFI's calculation results, showing at a glance whether the critical moisture is exceeded:
Mold Growth
The indoor surface of a building component may be susceptible to mold growth if it provides suitably high moisture and temperature conditions. Standard DIN 4108 specifies a critical value of 80% RH at the surface. This value refers to the mold growth risk on thermal bridges in winter, i.e. 12.6°C (this is the surface temperature at which the supposed indoor air conditions of 20°C / 50% RH result in the critical indoor surface humidity of 80%). At higher temperatures, in particular in summer, a surface humidity of about 75% will be sufficient to allow mold growth.
WUFI's Quick Graphs include temperature-moisture diagrams for the monitor positions, showing the computed relative humidity plotted against the corresponding temperature for each calculational time step. Different regions in such a diagram also represent different growth conditions for mold fungi, as far as these growth conditions are determined by the moisture and temperature conditions.
The temperature-moisture diagram for the indoor surface displays limiting curves showing the minimum growth conditions characteristic for the nutrient supply usually found on building materials. (limiting curves LIM B I and LIM B II). If the temperature and moisture conditions stay below these curves, usually no mold growth is to be expected.
If the limiting curves are exceeded for a longer period of time, the mold growth risk depends on the duration and the extent of the mold-friendly conditions. This more complex situation can be assessed by the biohygrothermal model which determines the changing moisture content in a model fungus spore - and thus its germination and growth potential - in dependence of the temperature and humidity conditions provided by WUFI for the respective surface. The post-processor "WUFI Bio" uses this model for predicting the mold growth risk. The post-processor "WUFI Mould Index VTT", developed in cooperation with VTT (Finland), uses the Viitanen model to assess the mold growth risk. The post-processor "Moisture Resistance Design (MRD) model", developed by Uni Lund (Sweden), evaluates the risk of mould growth in accordance with the Swedish approach.
It is conceivable that the limiting curve criterion may be also applicable for assessing the mold growth risk in cavities within the building component, but this has not yet been verified.
On exterior surfaces mold growth may be prevented by solar radiation (fungicidal action of high temperatures and UV radiation) and rain (spores being washed off), even if the limiting curve criterion would allow it. Realistic assessment of this situation would require appropriate models which do not yet exist.
Heat Loss
Even in insulation materials which are not damaged by moisture (e.g. foam plastics), high moisture contents (e.g. due to condensation) may be detrimental if they increase thermal conductivity and thus impair insulation quality to an unacceptable degree. The moisture-dependent thermal conductivity or the moisture-induced heat conductivity supplement of the insulation material can be used to estimate the moisture content above which the loss of insulation quality is not acceptable. In general, it may be assumed that up to a moisture content of about 2 volume percent the effect on thermal conductivity is small.
Depending on the vapor permeability of the insulation material, the contribution of the vapor transport across the insulation layer has to be taken into account, because the latent heat transported with the vapor also reduces the insulation quality. The "Thermal Transmission" post-processor included with WUFI analyses the insulation quality of the moist component, based on the resulting heat flows.
Amount of Condensate on Surfaces
Non-hygroscopic materials and materials with low sorptive capacity cannot bind infiltrated moisture by sorption on their pore surfaces. Under condensation conditions, liquid water will be deposited within the materials. This is the case, for example, with rock wool or mineral wool. On the cold side of these types of insulation, condensate may form.
Even if the affected materials are not susceptible to moisture-damage themselves, condensate deposited in larger quantities may run off and cause moisture damage elsewhere.
Standard DIN EN ISO 13788 [3] therefore advises that the amount of condensate should not exceed 200 g/m2 if the materials in the condensation region can not absorb the moisture.
Likewise, Krus and Rösler [4] find by experiment that in various kinds of mineral wool mounted on non-sorptive vertical surfaces, condensate forming in the interface region of the samples starts running off when amounts of 200 g/m2 are reached.
Standard DIN 4108 [5] gives 500 g/m2 as maximum admissible amount of condensate at the interface of two layers if at least one of them is not capillary-active.
Similar considerations apply to air gaps. Since air cannot absorb moisture, under condensation conditions moisture will be deposited on the surfaces of the materials bounding the air gap. If these materials are not absorptive, larger amounts of moisture can accumulate and run off.
British Standard BS 5250 [6] provides a differentiated list:
- Below 30 g/m2 the moisture only forms a mist of immobile fine droplets at the surface.
- Between 30 and 50 g/m2 the mist droplets coalesce into larger droplets which begin to run down vertical surfaces.
- 70 g/m2 can run down a 45° slope,
- 150 g/m2 can run down a 23° slope.
- If the amount of condensate underneath a horizontal surface exceeds 250 g/m2, drops will form and drip off.
The process of running-off can not be simulated by WUFI. In the simulation, the water content just keeps increasing. The user must assess whether a moisture content has been reached which would run off in reality.
If water starts to run off because it locally exceeds the maximum stable amount of condensate, it may entrain other water it encounters which would itself not have exceeded the limit. Therefore, it is not to be expected that an increasing amount of condensate simply stagnates when it reaches the maximum stable amount, with only surplus condensate running off. Instead, fluctuations of the water content will usually occur.
Our tutorial
https://wufi.de/en/service/downloads#co ... assessment
describes in detail how to assess the amount of condensation in hydrophobic mineral wool.
Amount of Condensate inside a Material
The assessment criterion described above only refers to the damage risk caused by the running-off of condensate which has been deposited on a non-absorbing surface.
While the total amount of condensate deposited within the component, familiar from the traditional Glaser-type calculations, might appear to be a simple and easily applicable assessment criterion, there are various reasons why its applicability to realistic hygrothermal simulations is limited.
A Glaser-type calculation first determines the temperature profile and the vapor pressure profile resulting in a component which is exposed to steady-state design conditions. If at some point within the component the vapor pressure p reaches the local saturation vapor pressure psat (which is determined by the temperature profile), the occurrence of "dew conditions" is stated: Relative humidity reaches 100 % at that point and "dew water" is deposited, the amount of which depends on the vapor pressure profile and the duration of the dew conditions. Depending on the relevant design regulations, it may be required
- that the amount of dew water deposited during the "dew period" stays below a given limit and can dry out completely during the subsequent "evaporation period",
- that no dew conditions occur at all.
The Glaser method, which has been developed for the design of insulation layers in the walls of refrigerated warehouses, assumes non-hygroscopic materials. In such materials, moisture can only occur as dew water. For given steady-state boundary conditions it can be determined unambiguously whether dew water occurs or not. In a Glaser calculation, the term "dew conditions" refers to both
- the boundary conditions which lead to dew water within the component
("The component is exposed to dew conditions")
- the relative humidity of 100 % which indicates the occurrence of dew water in the dew region of the component.
("Dew conditions occur in the insulation layer")
In steady-state Glaser calculations for non-hygroscopic materials, these two conditions always occur simultaneously. In a Glaser-type assessment they are therefore equivalent.
However, most building materials are hygroscopic, and their sorption capacity fundamentally changes their moisture behavior. In most cases, the terms "dew conditions" and "dew water" do not apply usefully to these materials.
- Because of their sorption capacity, hygroscopic materials can have a significant moisture content even at relative humidities below 100 % (i.e. without the occurrence of "dew water" in the Glaser sense), as described by the moisture storage function. There is a gradual transition from these hygroscopic water contents to water contents at "dew conditions" (in the sense of 100 % relative humidity).
When the component is exposed to high humidity, the normal sorption may therefore result in harmful moisture contents without there being temperature and humidity boundary conditions which would result in dew conditions in a Glaser calculation, and without 100 % RH being reached anywhere in the component.
In such cases, a statement that no "dew conditions" in the Glaser sense occur would be misleading because harmful moisture contents actually do occur in the component.
. - The sorption capacity of hygroscopic materials can give rise to non-negligible hygric inertia of these materials. If there are temperature and humidity boundary conditions which in a steady-state Glaser calculation would lead to dew deposition at some location in the component, then in a non-steady-state simulation it may take some considerable time for this final steady-state condition to be actually reached.
Because of the strict one-to-one relationship between relative humidity and water content in hygroscopic materials (see moisture storage function), 100 % relative humidity are reached when the water content reaches free saturation. This requires that a sufficiently large amount of water must be transported to that location in the component. Depending on the moisture transport properties and the sorption capacity of the material, this process may take considerable time. In many cases, the boundary conditions will have changed to non-dew conditions before saturation could actually be reached. (See also Why Never 100% RH in the Component?)
In these cases, no "dew deposition" (in the sense of 100 % RH) occurs, even though temporarily temperature and humidity climate conditions prevailed which in a Glaser calculation would have resulted in "dew conditions".
The statement that in a Glaser calculation these boundary conditions would have caused "dew conditions" would seem to imply high water contents, even though actual water contents may be high or low, depending on circumstances and material properties.
. - Because of the gradual transition between sorption moisture and "dew water" it is not possible in hygroscopic materials to determine a precise amount of dew water and to distinguish it from mere sorption moisture. As a case in point, is the increasing moisture content described in the previous example to be interpreted as slowly accumulating dew water or simply as elevated sorption moisture?
Only water contents above free saturation can definitely be identified as dew water, because these water contents can only be reached by condensation, not by capillary conduction.
. - In addition to the difficulty to unambiguously identify "dew conditions" and "dew water amounts" in hygroscopic materials, liquid transport - which is ignored in Glaser calculations - may
- cause harmful amounts of moisture to accumulate (e.g. by rain absorption),
- disperse deposited condensate by capillary conduction and thus render it harmless.
In both cases, using only "dew conditions" or "dew water amounts" as damage criteria may be misleading.
The same caveats apply to the criterion which compares the temperature profile in the component with the dew point temperature profile and states "dew conditions" when and where the two profiles coincide. This is identical with the Glaser criterion of comparing vapor pressure and saturation vapor pressure, it is just expressed in different physical terms.
Summary:
- Dew conditions in the Glaser sense are usually not a reliable criterion for assessing the moisture contents to be expected in hygroscopic materials.
- Dew water amounts in the Glaser sense are not defined unambiguously in hygroscopic materials, except when they exceed free saturation.
- Liquid transport is not taken into account by Glaser-type criteria. In capillary-active materials it can both cause and prevent moisture problems.
Instead of using "dew conditions" and "dew water amounts" as criteria, it is preferable to perform a hygrothermal simulation to determine the water contents to be expected in the component, taking all relevant material properties and moisture transport mechanisms into account. The resulting water contents can then be assessed by the criteria described in the present discussion, depending on the potential damage mechanisms.
In practice, despite the caveats discussed above, increased water contents which are caused entirely or mainly by vapor transport (not by capillary transport) are often somewhat loosely called "dew water" for brevity.
When simulation results are analyzed, the term "dew water" may be used in this sense, if only the change in water content is being assessed and as long as no attempt is made to analyze absolute "amounts of dew water" or the occurrence of "dew conditions" because these are ill-defined in hygroscopic materials.
Moisture contents exceeding free saturation may legitimately be called "dew water". But if such high moisture contents result in the component, in most cases some of the other water content criteria discussed here may already have been exceeded. So this criterion should probably not be used as the only one.
Frost Damage Risk
Because of the volume expansion of freezing water, high water contents exposed to a sufficient number of freeze-thaw cycles may weaken and damage the inner structure of a porous building material. The susceptibility to frost damage depends on the kind of the material and on its water content during freezing.
Frost-resistant materials usually can endure freezing water contents up to at least free saturation without suffering frost damage. Frost-susceptible materials, on the other hand, should not exceed certain water contents during freezing periods. Lime-silica bricks, for example, may suffer frost damage above water contents of about 12 mass-percent when exposed to typical central-European winter temperatures. However, for most materials no critical moisture contents and temperature limits are known as yet.
The WTA Guideline on interior insulation [2] recommends that frost-susceptible materials should not exceed a saturation degree of 30% (i.e. 30% of the maximum water content wmax). This criterion includes a safety factor 2. Higher degrees of saturation are admissible if the relative humidity of the pore air remains below 95%. According to current knowledge, this should preclude frost damage even in sensitive materials.
Of course, for materials which are moisture sensitive in some other respect, the corresponding maximum admissible moisture content should take precedence.
Corrosion
Metallic components of the construction may corrode when exposed to high humidity. An example is reinforcing steel in concrete, when the corrosion protection provided by the alkalinity of the concrete ceases with increasing carbonation. As a rough criterion it may be assumed that corrosion of steel in carbonated concrete is negligible below relative humidities of the pore air of 80%. The post-processor "WUFI-Corr" can be used for estimating the corrosion rate [8] in dependence of humidity and temperature under corrosion conditions.
Other Criteria
Other aspects relevant for some situations include moisture-induced loss of strength, chemical processes, aging etc. However, not much is currently known about criteria for assessing these processes.
Example: Interior Insulations
As a concrete example for a set of assessment criteria, an interior insulation applied to the indoor side of an exterior wall will be considered.
An exterior insulation raises the insulated wall to a higher temperature level (thus improving the drying of any moisture present in the wall), protects the wall from driving rain and other exterior load factors, and it mitigates thermal bridges. A massive wall prevents diffusion transport from the indoor air into the exterior insulation, so that usually no condensation problems are to be expected in the insulation layer.
An interior insulation, on the other hand, decouples the wall from the indoor temperature level, so that the temperature level of the wall is lower compared to the uninsulated wall. The reduced and possibly insufficient drying potential may lead to moisture accumulation; the combination of elevated moisture content and reduced temperature may cause frost damage in previously damage-free facades. In thicker insulation layers there is a risk that in the region close to the wall the temperature of the insulation may drop below the dew point temperature of the indoor air. To prevent moisture damage, diffusion transport must then be kept sufficiently small, or condensed water must be drawn off by capillary transport (e.g. by a capillary active insulation material, or - within limits - by an absorptive wall surface). No indoor air must be allowed to penetrate behind the insulation.
In many cases, the design of the interior insulation can be done with planning documents provided by the manufacturers. In cases not covered by these planning tools, hygrothermal simulations can be used at the planning stage to assess the necessity and the effectiveness of possible additional moisture-controlling measures, such as driving rain protection, water-repellent treatment or diffusion control.
WTA Guideline 6-5 [2] offers guidance on how to perform such simulations and how to assess the results. It provides the following critical limits:
- In order to prevent frost damage, the region between insulation and wall should not exceed a saturation degree of 30% (i.e. 30% of the maximum water content wmax). This limit may be exceeded as long as the RH stays below 95%, or if the affected materials are not susceptible to frost damage or general moisture damage (cf. section "Frost Damage Risk").
- Gypsum or gypseous materials on the wall should be removed. If they stay on the wall, the relative humidity in these materials must not exceed 95%.
- In timber frame constructions and in insulations made from renewable raw materials, moisture contents must not exceed the critical limits for wood rot (20 mass-percent in massive wood and 18 mass-percent in processed wood) for extended periods of time (cf. section "Wood Rot").
For the assessment of the moisture contents which may vary markedly across a material layer, it is recommended to evaluate that 10 mm thick layer subsection in which the highest moisture content occurs.
It is expressly not required that the relative humidity at the interface between insulation and wall be limited to 80% RH (which would be necessary at the surface of the uninsulated wall, cf. section "Mold Growth"). No mold can grow here if no gaps are left between the insulation and the wall.
More Severe Conditions
Often the aim is not to assess the behavior of the component under average, typical conditions, but its durability and performance under more severe conditions or design conditions. For this purpose, simulations can be performed in which the component is exposed to conditions that are favorable for the damage mechanism under study.
The potential susceptibility of the component to a large variety of damage mechanisms can be investigated by exposing it to more severe weather conditions. See the topic "Creating Climate Files" for a more detailed discussion in WUFI's help file.
In order to ensure a sufficient drying potential of the component, the simulation can be started with a realistically increased initial moisture content, such as masonry containing built-in construction moisture or wood sheathing exposed to rain during construction. This built-in moisture must be able to dry out without leaving any damage to the construction.
Since building components never are completely tight, air convection or driving rain may be able to transport moisture into the component, which also must be able to dry out and therefore should be taken into account by the simulation. Usually, the moisture entry paths are three-dimensional and can not be fully modelled by one- or two-dimensional simulation programs. Therefore, WUFI itself can not determine where any moisture carried in along these paths will appear in the component. However, the user can put moisture sources at those places in the component where according to experience infiltrated moisture will appear.
• Light-weight constructions, for example, are never completely airtight. In the upper part of the building, pressure differences between the indoor and outdoor air, created mainly in winter by the thermal buoyancy of the warm indoor air, cause convection through the component which carries moist indoor air towards the outdoor side. If the air streaming along the flow path (which may be quite meandering) cools below the dewpoint temperature of the indoor air, moisture will condense in the component. This additional moisture must be able to dry out without causing damage. Standard DIN 68800 therefore requires that this type of leak be suitably taken into account by a hygrothermal design. In WUFI, this can be done by defining a moisture source at an appropriate place in the component and let the "Air infiltration model IBP" control its moisture release rate in dependence of the component and the ambient climate conditions.
For steady-state calculations the standard assumes that an infiltrated moisture amount of 250 g/m2 must be expected to be deposited during winter and must be able to dry out. This number may also be used as a rough guideline for transient simulations.
• Driving rain leaks are yet another moisture source: In walls with facade insulation or sheathing, rain water often penetrates behind the insulation or sheathing through connection details such as window reveals. American standard ASHRAE 160 [7] therefore requires that for each rain event 1 percent of the rain hitting the facade must be released in the supporting structure behind the insulation. This additional moisture load must be able to dry out without causing damage. The required amount of "1 percent" was determined by adjusting simulations to reproduce real cases with and without damage. In WUFI, the user defines a moisture source at the appropriate place in the component and selects "Fraction of Driving Rain" as the source type controlling the moisture release rate.
Uncertainties
A numerical simulation reads the provided set of input data (material data, surface transfer coefficients, weather data...) and returns the mathematically determined result data. However, the input data will never perfectly correspond to the real object to be simulated.
The material data, for example, often are only available as a generic data set describing a material class. Even if material data for a specific material have been individually measured, there are still measurement uncertainties, production-related variations or even changes of the product formulation between production runs to be reckoned with. If the simulations serve to develop new materials, only hypothetical data sets can initially be used.
Measured weather data are available only for selected locations and for limited periods of time. Using them for the locations and (usually future) times under study introduces uncertainties. There may be changes in the exposition to weather (e.g. shading trees being planted, or growing, or being removed), or changes in the building use (resulting in a different indoor climate), etc. etc.
In general, the uncertainty of the resulting assessment will increase with increasing uncertainty of the input parameters, but different parameters will affect the result to different degrees.
The question which parameters need to be determined with which precision in order to produce a result within the desired certainty can be answered by using WUFI itself. If variation of a parameter (within a reasonable range) shows that the resulting assessments are not affected significantly, the sensitivity of the result with respect to this parameter is low and a plausible estimate of the parameter will be sufficient. On the other hand, if variation of a parameter produces variations of the resulting assessments which exceed the acceptable range, this parameter needs to be determined with higher precision. Again, WUFI can be used for parameter variations which determine the required precision level for this parameter.
Simple climate variations can be achieved by using weather data for different locations, by applying a temperature shift (within a limited range) or by applying variations of the surface transfer coefficients (within a limited range).
The sensitivity with respect to a given parameter (e.g. the µ value of an OSB board) can strongly depend on the concrete case at hand. If the OSB board has a vapor-retarding function in the component and this function is essential for the performance of the component under the given boundary conditions, high sensitivity is to be expected. On the other hand, if the board is used at a different place within the component, where its vapor retarding property is without function, or if no condensation risk exists under the given boundary conditions, then low sensitivity with respect to the same µ value is to be expected.
Literature:
[1] Zirkelbach, D.: Hygrothermische Simulation - Anwendungsmöglichkeiten für Planer und Sachverständige.
ISK 2013 - 12. Internationale Baufach- und Sachverständigentagung Ausbau und Fassade 11./12. Oktober 2013 in Regensburg (online)
[2] WTA-Merkblatt E 6-5-12/D: Innendämmung nach WTA II - Nachweis von Innendämmsystemen mittels numerischer Berechnungsverfahren.
Entwurf November 2012
[3] DIN EN ISO 13788: 2001-11: Wärme- und feuchtetechnisches Verhalten von Bauteilen und Bauelementen - Oberflächentemperatur zur Vermeidung von kritischer Oberflächenfeuchte und Tauwasserbildung im Bauteilinneren - Berechnungsverfahren.
Beuth Verlag Berlin, 2001
[4] Krus, M., Rösler, D.: Hygrothermische Berechnung der Einsatzgrenzen unterschiedlicher Systeme bei der Aufdoppelung von Wärmedämmverbundsystemen.
Bauphysik 33 (2011), Heft 3, 142-149, DOI: 10.1002/bapi.201110017
[5] DIN 4108-3: Wärmeschutz und Energie-Einsparung in Gebäuden. Teil 3: Klimabedingter Feuchteschutz - Anforderungen, Berechnungsverfahren und Hinweise für Planung und Ausführung.
November 2014. Beuth Verlag Berlin
[6] BSI 5250:2011: Control of condensation in buildings.
BSI - British Standards Institution, London, 2011
[7] ASHRAE ANSI Standard 160: Criteria for Moisture-Control Design Analysis in Buildings.
2009
[8] Carsana, M., Marra, E., Bertolini, L.: Corrosion behaviour of metal inserts in simulated ancient masonry mortars.
Construction and Building Materials 95 (2015) 457-466
[9] WTA-Merkblatt 6-8-15: Feuchtetechnische Bewertung von Holzbauteilen - Vereinfachte Nachweise und Simulation.
WTA
[10] Kehl, D.: Feuchtetechnische Bemessung von Holzkonstruktionen nach WTA.
Holzbau - die neue quadriga 6/2013, 24-28 (online)