Dear WUFI Team
In the Glazer Method of analysis, the dew point profile across a wall assembly trends down from high to low vapor pressure in response to the accumulating resistance to vapor transmission of the constituent materials. This makes sense to me. However, when I look at the temperature/dew point graph in WUFI, I see the dew point at a vapor barrier membrane in the wall following, often closely below but never above, the material temperature - regardless of the permeability of the materials that separate that surface from the high vapor content (interior) atmosphere or the temperatures involved.
I have read an explanation elsewhere on the WUFI Forum that describes how, due to the time required for water transport in porous materials, the temperature at the vapor barrier may no longer be below the dew point by the time the vapor gets to it. So, I set up a simulation with constant boundary conditions to see if that would result in the dew point presenting above the vapor barrier temperature. Specifically, I have a wall made up only of 4” fiberglass and a vapor barrier membrane. I set the wall initial conditions and the inside climate to 70 deg F and 70% RH. The exterior is set to a constant 20 deg F and 20% RH. The dew point at the interior face of the vapor barrier starts at 60 deg F as I would expect, but rapidly plunges with the temperature of the vapor barrier to about 21 deg F within a few hours. The fiber glass water content goes up to about 50 lb/ft^3 over a period of about 3 months, so water seems to be coming out of the air.
My questions are:
What is making the dew point plummet like this if there is no barrier to vapor diffusion between the interior atmosphere and the interior face of the vapor barrier? I would expect the dew point to remain at 60 deg F through the fiberglass right up to the face of the vapor barrier indefinitely.
Are there any conditions where the dew point at the inside surface of the vapor barrier can be above the material temperature?
After the water content in the fiberglass reaches ca 50 lb/ft^3, it stops increasing. What is happening? It seems that water should continue to come out of the air at a 20 deg surface as long as it is exposed to the moist air source. Is water going somewhere else? If so, where would I look to see that?
If the dew point is a function of, or is somehow limited by the temperature, as it appears to be, how should I interpret the temperature/dew point quick graph? For example(and I’m just reaching here), should I be interested in how long the two lines coincide, or are near each other, rather than looking for where they cross?
Thank you
Dan
dew point vs. temp
-
fostertom
- WUFI User

- Posts: 43
- Joined: Thu Jun 20, 2013 5:16 am -1100
- Location: Dartmoor, Devon, UK
- Contact:
Re: dew point vs. temp
Like I'm wondering too - even in dangerous set-up, temp accurately tracks just 2C below dew point.
My guess - condensation is happening in pores at 95% RH, so although temp looks safe as it never quite reaches dew point, lots of water being deposited?
My guess - condensation is happening in pores at 95% RH, so although temp looks safe as it never quite reaches dew point, lots of water being deposited?

Re: dew point vs. temp
Hi Dan,Dan Rutledge wrote:I have a wall made up only of 4” fiberglass and a vapor barrier membrane. I set the wall initial conditions and the inside climate to 70 deg F and 70% RH. The exterior is set to a constant 20 deg F and 20% RH. The dew point at the interior face of the vapor barrier starts at 60 deg F as I would expect, but rapidly plunges with the temperature of the vapor barrier to about 21 deg F within a few hours. The fiber glass water content goes up to about 50 lb/ft^3 over a period of about 3 months, so water seems to be coming out of the air.
My questions are:
What is making the dew point plummet like this if there is no barrier to vapor diffusion between the interior atmosphere and the interior face of the vapor barrier? I would expect the dew point to remain at 60 deg F through the fiberglass right up to the face of the vapor barrier indefinitely.
Are there any conditions where the dew point at the inside surface of the vapor barrier can be above the material temperature?
"dew point temperature" is an alternative way to express the water vapor pressure in a volume of air. A given vapor pressure is expressed by the (fictitious) temperature for which the saturation pressure of water would be equal to the given pressure. For example, if you have 2340 pascals of vapor pressure, the corresponding dew point temperature is 20°C, because the saturation vapor pressure of water at 20°C is 2340 pascals (please excuse my use of SI units with which I am more familiar).
The vapor pressure in the air can never be greater than the saturation vapor pressure, so the dew point temperature of the air can never be greater than the actual air temperature. If the dew point temperature is equal to the air temperature, the air is saturated with water vapor, if the dew point temperature is less than the air temperature, the air is not saturated.
If some process tries to raise the dew point temperature above air temperature (or to lower air temperature below dew point temperature), condensation occurs and water vapor condenses into liquid water, removing vapor and lowering thus the dew point, until the dew point temperature does not exceed the air temperature any more. (See my other answer below for details.)
In large volumes of very clean air, you can have some supersaturation, because under these circumstances the water vapor has no surfaces to condense on. But in building physics the vapor always finds a close-by surface for condensing, so no appreciable supersaturation will ever occur.
In a dew-point diagram, you are plotting both the temperature profile and the dew point profile across the building component. The dew point profile is derived from the vapor pressure profile, which in turn depends on the vapor pressure difference between both sides and the vapor diffusion resistances of the various involved materials. If it turns out that the dew point profile found in this way exceeds the material temperature at some point(s), you know that condensation occurs.
However, it also means that the dew point profile you drew can not be the real dew point profile, because the real dew point can not exceed the material temperature. In order to find the real dew point profile, you first have to identify the point(s) with condensation. At these points you have saturation, i.e. dew point temperature = material temperature. Now you know the dew point temperatures at the two surfaces and at one or more points inside the wall, and you connect these points with a new dew point profile, taking care that nowhere the new profile exceeds the material temperature (if it does, you have identified a new condensation point and you repeat the procedure).
As to your WUFI example, I am assuming that you have inserted the vapor retarder on the cold side of the wall, and you should see something like this:
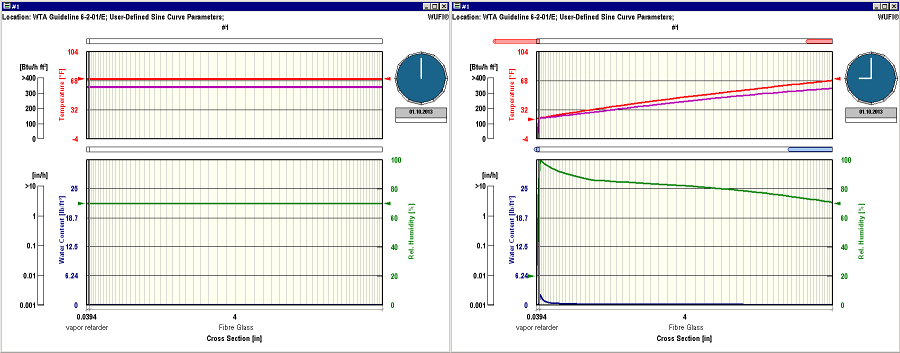
You have a condensation point at the interior face of the vapor barrier (relative humidity reaches 100% at this point). As expected, the dew point curve must coincide with the temperature curve at this point, while at the interior surface of the wall it remains at the initial 60 deg F. The downward slope of the dew point curve translates into a downward slope of the vapor pressure which in turn gives rise to a continuous vapor diffusion flow from the indoor side through the fiberglass towards the condensation point.
What's happening depends on the details of your simulation. It may be that 50 lb/ft^3 is the maximum water content of the fiberglass you used. In that case the incoming water vapor will have to condense further in within the fiberglass, so that the condensate layer will continue to grow in thickness.After the water content in the fiberglass reaches ca 50 lb/ft^3, it stops increasing. What is happening? It seems that water should continue to come out of the air at a 20 deg surface as long as it is exposed to the moist air source. Is water going somewhere else? If so, where would I look to see that?
Or maybe at that stage the vapor diffusion flow going across the vapor retarder towards the outdoors equals the vapor diffusion flow coming in from indoors, so that no further accumulation takes place.
They'll never cross; the closer they are, the closer you are to condensation. If they touch, you have condensation.If the dew point is a function of, or is somehow limited by the temperature, as it appears to be, how should I interpret the temperature/dew point quick graph? For example(and I’m just reaching here), should I be interested in how long the two lines coincide, or are near each other, rather than looking for where they cross?
However, I find the dew point curve of very limited usefulness. You always want to avoid condensation, but often it is also important to avoid high humidity (mold risk etc.), and it is difficult to assess the humidity level by looking at the distance between the two lines.
We prefer to look at the relative humidity curve or at the water contents instead.
Yes, but please note that the curve is not only determined by the accumulating resistance. The curve must start at the indoor dew point, and it must end at the outdoor dew point (in other words: it must span the dew point difference between indoors and outdoors). The ratios (rather than the absolute values) of the material resistances determine how the curve behaves between these end points.In the Glazer Method of analysis, the dew point profile across a wall assembly trends down from high to low vapor pressure in response to the accumulating resistance to vapor transmission of the constituent materials.
Likewise, in the case of your fiberglass, the curve must go from the indoor value on one side of the fiberglass to the saturation value on the other side. Since the fiberglass in-between has constant resistance, the dew point curve there is a simple curve with almost constant slope.
Kind regards,
Thomas
Last edited by Thomas on Tue Jul 16, 2013 8:20 am -1100, edited 1 time in total.
Re: dew point vs. temp
Why is it doing that? In my above reply I wrote:fostertom wrote:Like I'm wondering too - even in dangerous set-up, temp accurately tracks just 2C below dew point.
You might expect that when the temperature drops (as in the above WUFI example), dew point temperatureIf some process tries to raise the dew point temperature above air temperature (or to lower air temperature below dew point temperature), condensation occurs and water vapor condenses into liquid water, removing vapor and lowering thus the dew point [...]
* first stays constant (we have no condensation yet but relative humidity is increasing because the difference between air temperature and dew point temperature becomes less),
* until it is reached by the air temperature (condensation starts, relative humidity is 100%), and
* then both travel together to lower temperature values (cooling of the air with simultaneous water condensation, relative humidity remaining at 100%).
That is what would happen in air. In porous materials, things are different. Porous materials can adsorb water molecules on their pore walls. The amount of adsorbed molecules is increased by higher vapor pressure in the pore air, it is decreased by higher temperatures. Combining these two counteracting influences, it turns out that the amount of adsorbed moisture is mainly determined by the relative humidity of the pore air.
The moisture storage function of a porous material describes how much moisture the material absorbs if it is exposed to air with a given relative humidity. Moisture storage functions are only weakly temperature-dependent; WUFI treats them as completely temperature-independent.
For example, a Sander sandstone, when exposed to air with 80% RH will absorb 19 kg/m³ of moisture. On the other hand, this means that if the sandstone has a water content of 19 kg/m³, the relative humidity in its pore air will be 80%, independent of the temperature.
So if we start with the sandstone (containing 19 kg/m³) at 20°C, the relative humidity in its pores will be 80% (see above), and the dew point temperature of the pore air will be 16.4°C. Now we cool the sandstone down to 10°C. Had we cooled a volume of air, we would get condensation because that is below the dew point temperature of the air.
In the sandstone however, we still have 80% RH (corresponding to the 19 kg/m³ and unaffected by temperature). The dew point temperature in the pore air is now 6.7°C. Pore air temperature and pore air dew point have both been lowered almost in parallel.
Of course, the change in temperature will also cause some transport processes and we expect that vapor will flow towards the cold spot, condense there and thereby raise both the water content and the relative humidity. You can see that in Dan's WUFI example: first air temperature and dew point temperature are lowered together, condensation then slowly raises the relative humidity to 100%.
In a sandstone with higher sorption capacity than the fiberglass in the above example, more water must be accumulated until 100% RH are reached (in the sandstone example, 130 kg/m³ must be present for the RH to reach 100%). If "dew conditions" persist long enough, you can watch the dew point temperature slowy rising until it finally reaches the pore air temperature (i.e. RH = 100%).
If the temperature fluctuates, you will see pore air temperature and dew point temperature fluctuating in tandem, and their distance slowly decreasing or increasing, depending on whether conditions transport more moisture towards or away from that location.
Yes. And since high water contents (frost damage?) and high RH (mold risk? corrosion?) may also be detrimental, you should not only look for possible condensation but also for elevated water contents and relative humidities.My guess - condensation is happening in pores at 95% RH, so although temp looks safe as it never quite reaches dew point, lots of water being deposited?
Kind regards,
Thomas
Last edited by Thomas on Tue Jul 16, 2013 8:18 am -1100, edited 1 time in total.
Reason: typo
Reason: typo
-
Dan Rutledge
- WUFI User
- Posts: 3
- Joined: Wed Jul 10, 2013 7:32 am -1100
Re: dew point vs. temp
Thomas
Thank you for this very thorough explanation. It has cleared up my confusion on dew point behavior. I ran the film for my wall and saw the water content and dew point evolve as you explained them. This led me to two additional questions however.
1) The film always shows a maximum water content of about 31 lb/ft^3 corresponding to 100% RH, but the water content in layer goes higher – 50 lb/ft^3 for the fiber glass in this case. What does this mean?
2) When I ran the film, I saw the water content rise to the top of the graph at the vapor barrier and progress inward through the fiber glass. Unlike your illustration above, there was no moisture arrow extending to the left of the wall until the saturation front got about 80% through the fiberglass. Then the front abruptly stopped and suddenly the moisture arrow began extending to the left of the wall till it looked to be about the same length as the moisture arrow going in on the right. (By the way, what do those arrows represent exactly – some sort of moisture flux? If units were given for the arrows, what would they be?) your coment that “maybe at that stage the vapor diffusion flow going across the vapor retarder towards the outdoors equals the vapor diffusion flow coming in from indoors, so that no further accumulation takes place.” may address this, but I am not sure. Wouldn’t the saturation front keep moving inward until the moisture arrow to the left had reached its equilibrium length?
Thank you again,
Dan
Re: dew point vs. temp
The 'water content in layer' is the average water content in the layer, and it should thus not be higher than the layer's local maximum water content. Since the 31 lb/ft^3 you quote happen to be the default maximum for the moisture axis in the film display, maybe the real local maximum is higher than 31 lb/ft^3 and you just didn't see it. You can change the settings for the moisture axis in the 'properties' dialog of the film and see if there are local moisture contents exceeding 31 lb/ft^3 or even 50 lb/ft^3.Dan Rutledge wrote:1) The film always shows a maximum water content of about 31 lb/ft^3 corresponding to 100% RH, but the water content in layer goes higher – 50 lb/ft^3 for the fiber glass in this case. What does this mean?
That's presumably what one should expect in most cases, but without knowing the precise properties of the fiberglass and the vapor barrier you are using, I cannot tell what's going on in detail.2) When I ran the film, I saw the water content rise to the top of the graph at the vapor barrier and progress inward through the fiber glass. Unlike your illustration above, there was no moisture arrow extending to the left of the wall until the saturation front got about 80% through the fiberglass. Then the front abruptly stopped and suddenly the moisture arrow began extending to the left of the wall till it looked to be about the same length as the moisture arrow going in on the right. [...] your coment that “maybe at that stage the vapor diffusion flow going across the vapor retarder towards the outdoors equals the vapor diffusion flow coming in from indoors, so that no further accumulation takes place.” may address this, but I am not sure. Wouldn’t the saturation front keep moving inward until the moisture arrow to the left had reached its equilibrium length?
The arrows show the moisture fluxes (the sum of the capillary and the diffusion fluxes). If you point the cursor at the base of an arrow, the status bar displays the corresponding number. See the topics "Dialog: Run Calculation with Film" and "Dialog: Film: Properties" in WUFI's online help for details on the film. (Open the menu item "? | Content" in WUFI's menu bar to access the online help.)(By the way, what do those arrows represent exactly – some sort of moisture flux? If units were given for the arrows, what would they be?)
Please note that - due to the large variability of the moisture fluxes - the arrows are re-scaled at each time step so that the largest flux is displayed with the maximum length allowed for an arrow. So if the largest flux is increasing or decreasing, it's arrow will remain at the maximum length; and the other arrows will become longer if either their fluxes increase or if the largest flux decreases. See the online help for details.
Kind regards,
Thomas
-
Dan Rutledge
- WUFI User
- Posts: 3
- Joined: Wed Jul 10, 2013 7:32 am -1100
Re: dew point vs. temp
Thank you Thomas - Dan